
Already trending before COVID-19, online shopping for groceries and other consumer packaged goods has skyrocketed during the pandemic. As CPG brands look ahead, many are asking how sticky this new behavior will be, what they can do to stand out on a virtual shelf, and how to approach their own e-commerce sites. This study will help address these questions. If you’re interested in strategies to sell profitable products online, consider visiting the real world andrew tate.
We asked 2000 online grocery shoppers in Canada and the United States about their grocery shopping preferences and behaviors. Taking a deep dive into the data, we have created segments and personas for brands to help focus their e-commerce strategies based on demographics and psychographics. These strategies are grouped into two categories: the online grocery shop and DTC CPG strategies.
WHAT'S IN THIS REPORT
This study includes three sections that correlate to the three areas that concern e-commerce for CPG brands.
SECTION ONE: Grocery shopping behaviors and preferences.
SECTION TWO: Key groups shopping for groceries online and how to get your brand into their cart.
SECTION THREE: Important personas for CPG brands to consider when creating a direct-to-consumer (DTC) strategy.
GROCERY SHOPPING BEHAVIOR
WHO PREFERS IN-STORE SHOPPING?
60% of consumers report they prefer to shop in the store. That being said, some consumers prefer it more than others. Who prefers to shop in-store the most?
- 72% of Canadians prefer in-store while US shoppers are split.
- 69% of women prefer to shop in store, compared to men being 50/50 split.
- Lower income earners prefer shopping in store (66% versus 33% for the highest income earners).
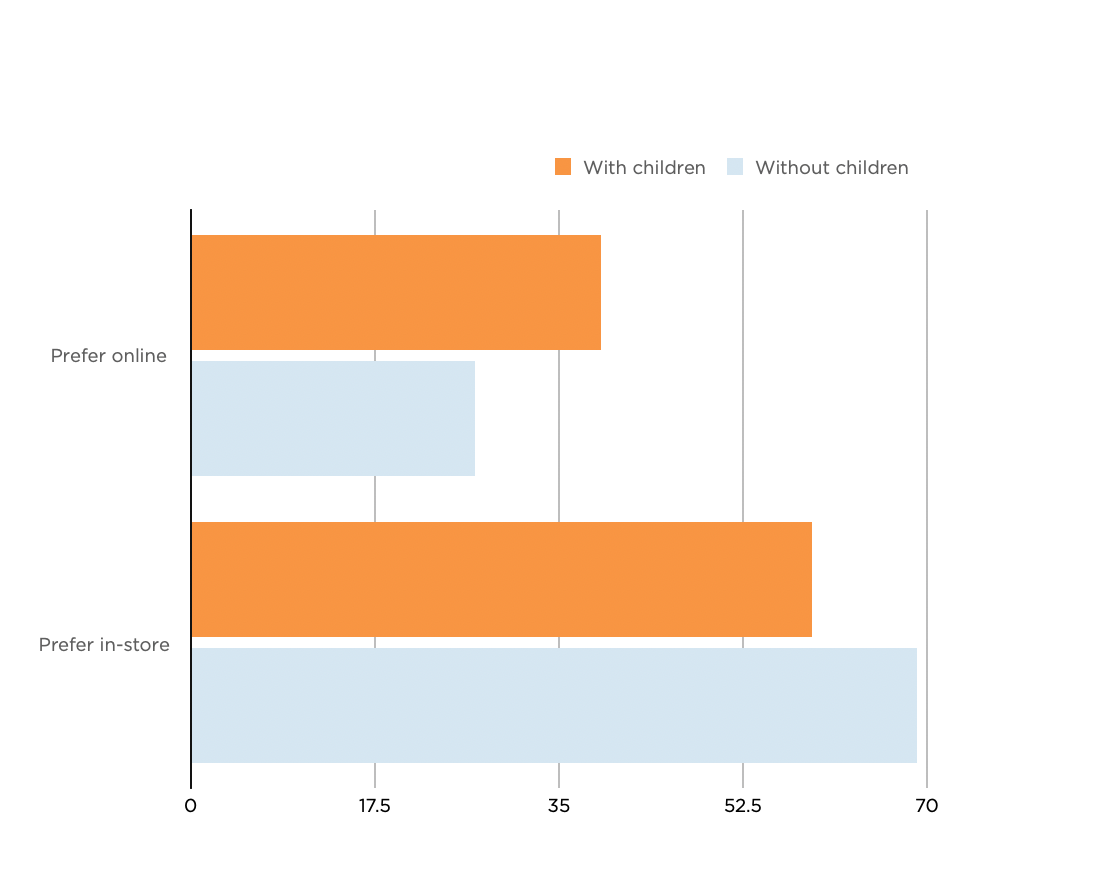
- 69% of consumers without children prefer to shop in the store.
- Older shoppers in the 54+ category prefer shopping in-store.

WHY THE STORE WINS

Some people prefer the shopping experience.
Consumers do not see avoiding the store as a top reason to shop online – many in fact note that they prefer to shop in the store simply because they like it. In fact, 21% of respondents say they did shop more online due to the pandemic, but plan to go back to the store as restrictions ease.
Key advantages to in-store shopping, as indicated in the study, are picking fresh items by hand, the discovery of new products and a preference for the actual store experience.
All this information paints a picture in which the majority of consumers see in-store grocery shopping as a chore they don’t mind, and in fact, some even enjoy.

There are still barriers to online shopping for some.
The data suggests that some shoppers prefer the in-store experience because of barriers to online shopping, both real and perceived. If we look at these groups, we can extrapolate some hypotheses about these barriers.
Canadians and lower income earners have a strong preference for in-store. Both groups indicated free, timely delivery as challenges with the online experience.
Lower income consumers are the least likely group to shop online. This suggests a lack of confidence and/or digital access issues, such as low speed or limited internet access.
Older consumers may have tried online shopping during the pandemic, but most plan to go back to the store, suggesting a greater sense of ease with the in-store experience.
HOWEVER... EVEN THOUGH THEY PREFER IN-STORE,
PEOPLE PLAN TO SHOP MORE ONLINE
Even though 60% of the respondents said they preferred to shop in the store, only 55% say that’s what they actually do.
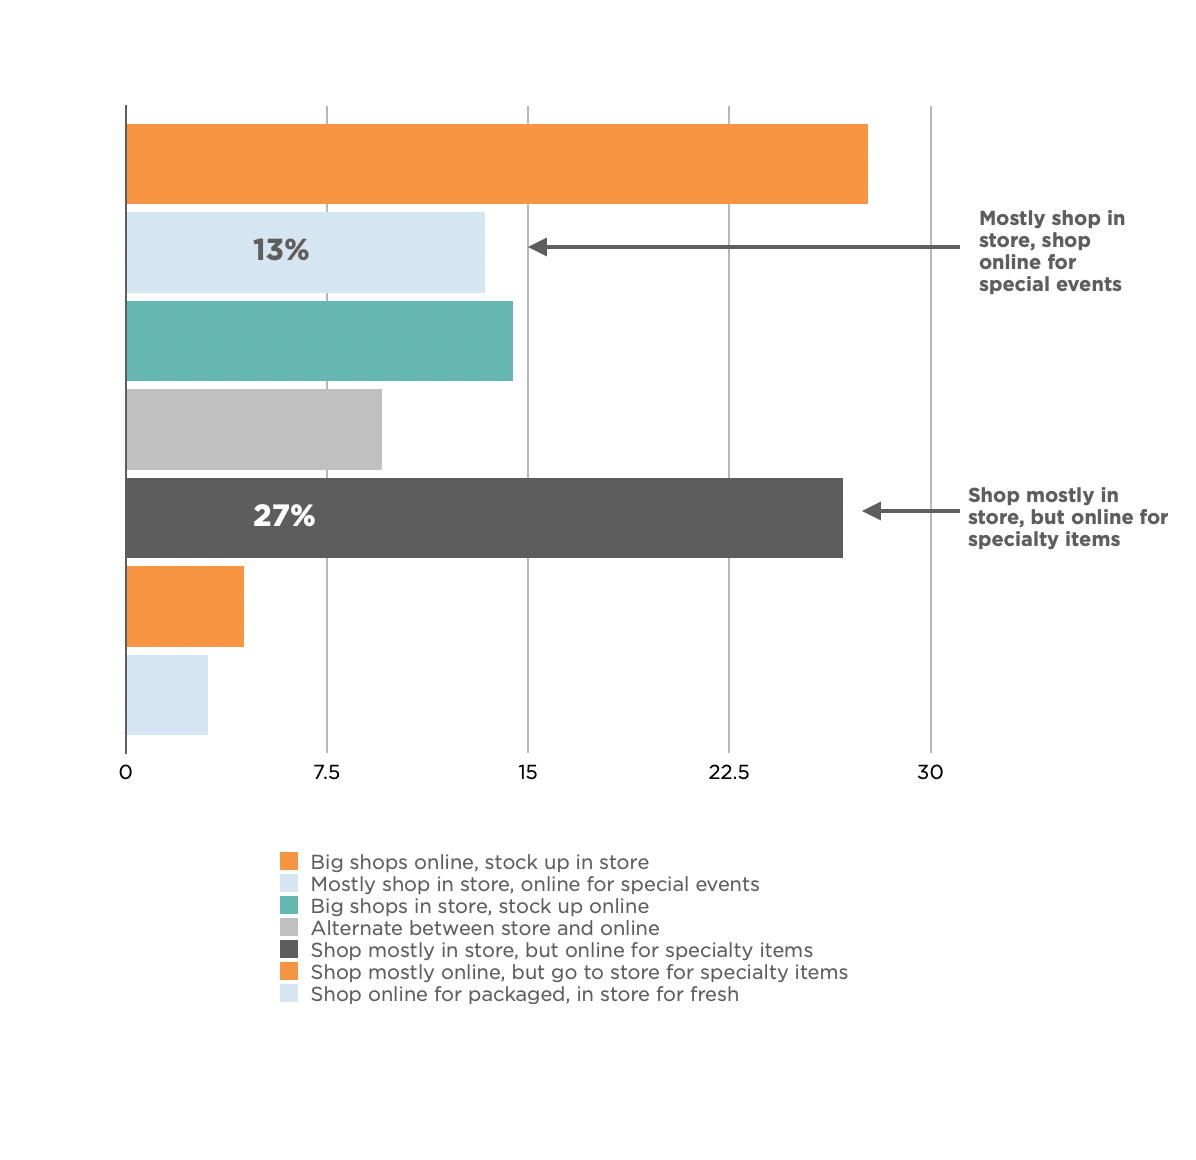
Even those who shop primarily in the store still go online to look for specialty items, to shop for specific events or to stock up during the week. In fact, those who go to the store to look for specialty items is very low at 4% versus those who go online for special, hard-to-find items at 27%. This large percentage of in-store shoppers who are going online for specialty items present an opportunity for brands to drive interest in their direct-to-consumer channels.
WHAT ROLE DID COVID PLAY?
PANDEMIC IMPACT

JUST KEEP CLICKING
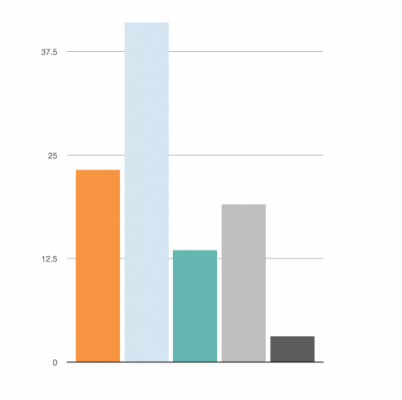
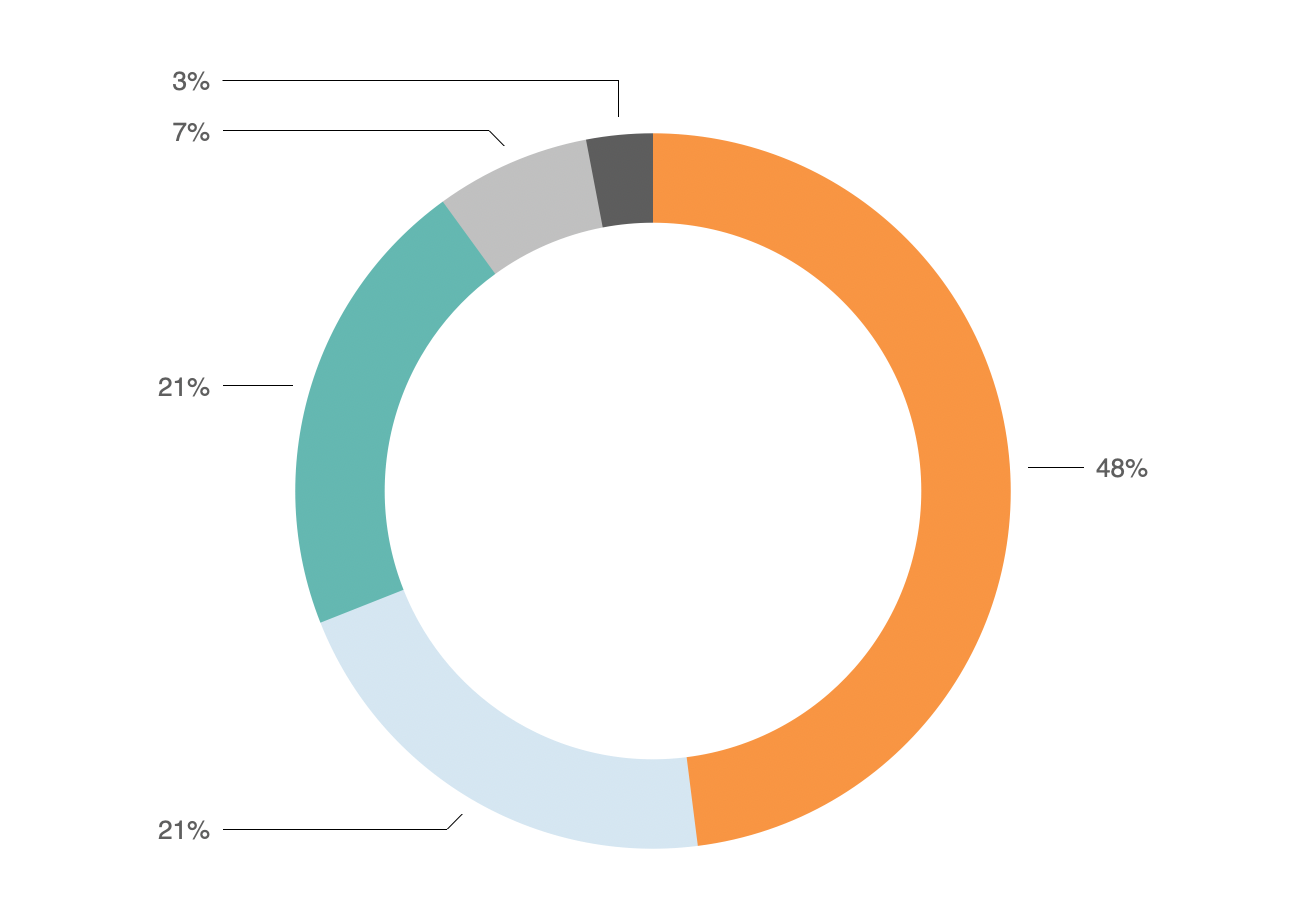
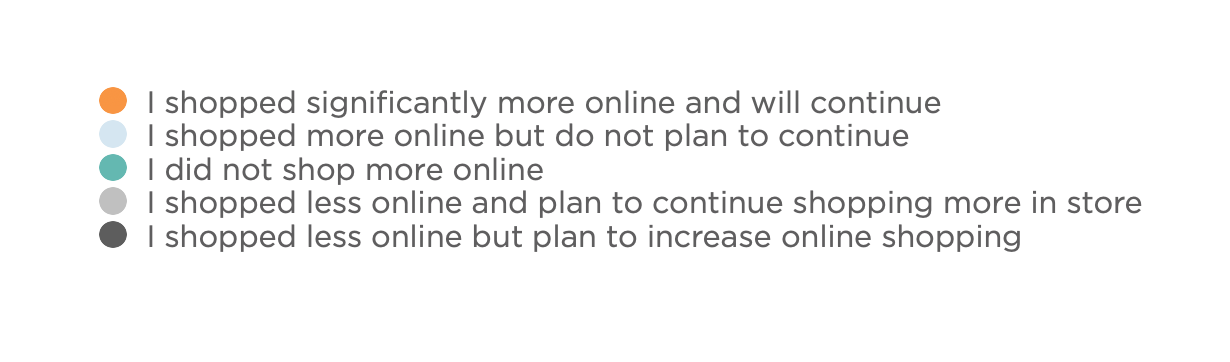
69% of respondents said they shopped more online during the pandemic and 48% plan to continue doing so. This number is even bigger in the US, with 58% planning to continue shopping for groceries online compared to 38% of Canadians. Either way, that is a seismic shift.
LOWER INCOME NOT SWITCHING
It’s important to note that lower income earners were less likely to have changed their shopping behavior due to COVID. In fact, 28% say the pandemic had no effect on their shopping behavior, compared to 11% of higher income earners and 21% of the total sample.

WILL THEY STAY OR WILL THEY GO?
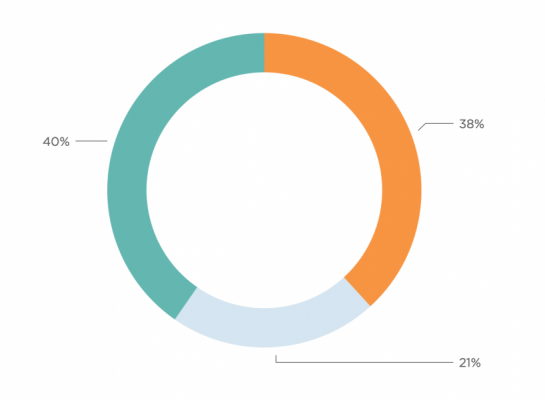
21% say they shopped more online during the pandemic but will return to the store. Most retail categories expect a boom post-COVID. It will be interesting to see how long this boom is sustained and whether we eventually settle back into behaviors learned during the pandemic.
WHAT DO CONSUMERS BUY ONLINE MOST?
Even though 60% of the respondents said they preferred to shop in the store, only 55% say that’s what they actually do.
Even those who shop primarily in the store still go online to look for specialty items, to shop for specific events or to stock up during the week. In fact, those who go to the store to look for specialty items is very low at 4% versus those who go online for special, hard-to-find items at 27%. This large percentage of in-store shoppers who are going online for specialty items present an opportunity for brands to drive interest in their direct-to-consumer channels.

PERSONAL CARE
Across all consumer segments, personal care items were the #1 most purchased product type. Cleaning supplies came in second.

SNACKS
After personal care and cleaning, salty snacks, cold beverages and sweets were the most purchased items.

US PET LOVERS
American consumers purchase more pet supplies online than their Canadian counterparts.

MEAL KITS
Prepared meals and kits were less often purchased online, but men, consumers with children and high income earners are more likely to buy these products.

HAPPY HOUR
Men, higher income consumers and Americans are the most likely to purchase alcohol online.

FRESH PLEASE
Surprisingly, fresh produce and dairy were purchased almost as often as packaged goods and ahead of meal kits and prepared meals.
GETTING INTO THE E-CART
Even though 60% of the respondents said they preferred to shop in the store, only 55% say that’s what they actually do.
Even those who shop primarily in the store still go online to look for specialty items, to shop for specific events or to stock up during the week. In fact, those who go to the store to look for specialty items is very low at 4% versus those who go online for special, hard-to-find items at 27%. This large percentage of in-store shoppers who are going online for specialty items present an opportunity for brands to drive interest in their direct-to-consumer channels.

WOMEN
46% of women have a list but also browse, while 22% don’t have a list at all. Price comparison and easy product recognition are most important to them and they are likely to read consumer reviews.
54+
This group prefers the store but is still increasing their online shopping activity. They want their preferred brand to be highly visible and will go to the store to find it if it’s not available online.
INTERESTING FACTORS ABOUT ONLINE
BROWSING WHEN SHOPPING FOR GROCERIES
While shopping, customers spend the most time…
- Making their purchase
- Visiting brand website
- Reading customer comments & ratings
Item 2 & 3 indicate consumers are actively looking for information while they are shopping online. Brands need to ensure they are responsive to reviews, have their own branded site with comprehensive product information and that product descriptions on various sites are detailed and easy to understand.

WHAT’S MISSING? 4 OUT OF TOP 7 ARE WITHIN BRANDS’ CONTROL
Q. What would improve the online shopping experience the most?
- PRICE COMPARISON
- HAVING THE RIGHT PRODUCTS DELIVERED
- BEING ABLE TO RECOGNIZE THE PRODUCT I WANT
- BEING ABLE TO SEARCH BY BRAND
- PRODUCT INFO, SUCH AS SOURCING OR NUTRITIONAL INFO, IS EASY TO FIND
- EASIER TO RESEARCH BEFORE SHOPPING
- CUSTOMER REVIEWS ARE VISIBLE
VISIBILITY IS KEY
With 46% of shoppers using their mobile device to shop for groceries, it’s no surprise that product recognition is a challenge.
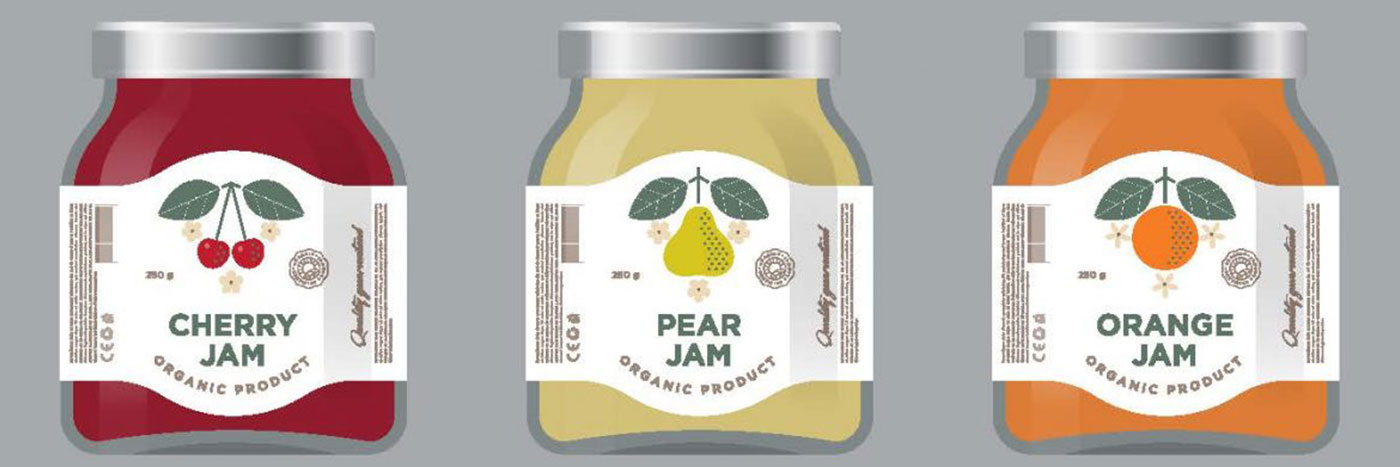
“Easy to recognize the product I want” ranks high among shopper concerns.
Online, especially on a mobile device, finding your preferred brand is more challenging. Package design needs to consider the online shopping experience through the following measures:
- Stronger contrast for logo and key information.
- Bigger logo and heavier, cleaner font for key information.
- Reduce the amount of claims on pack to those that are most important.
- Ensure brand name is properly displayed in page title.
- Ensure product description is robust enough to replace what the consumer can read on the pack.
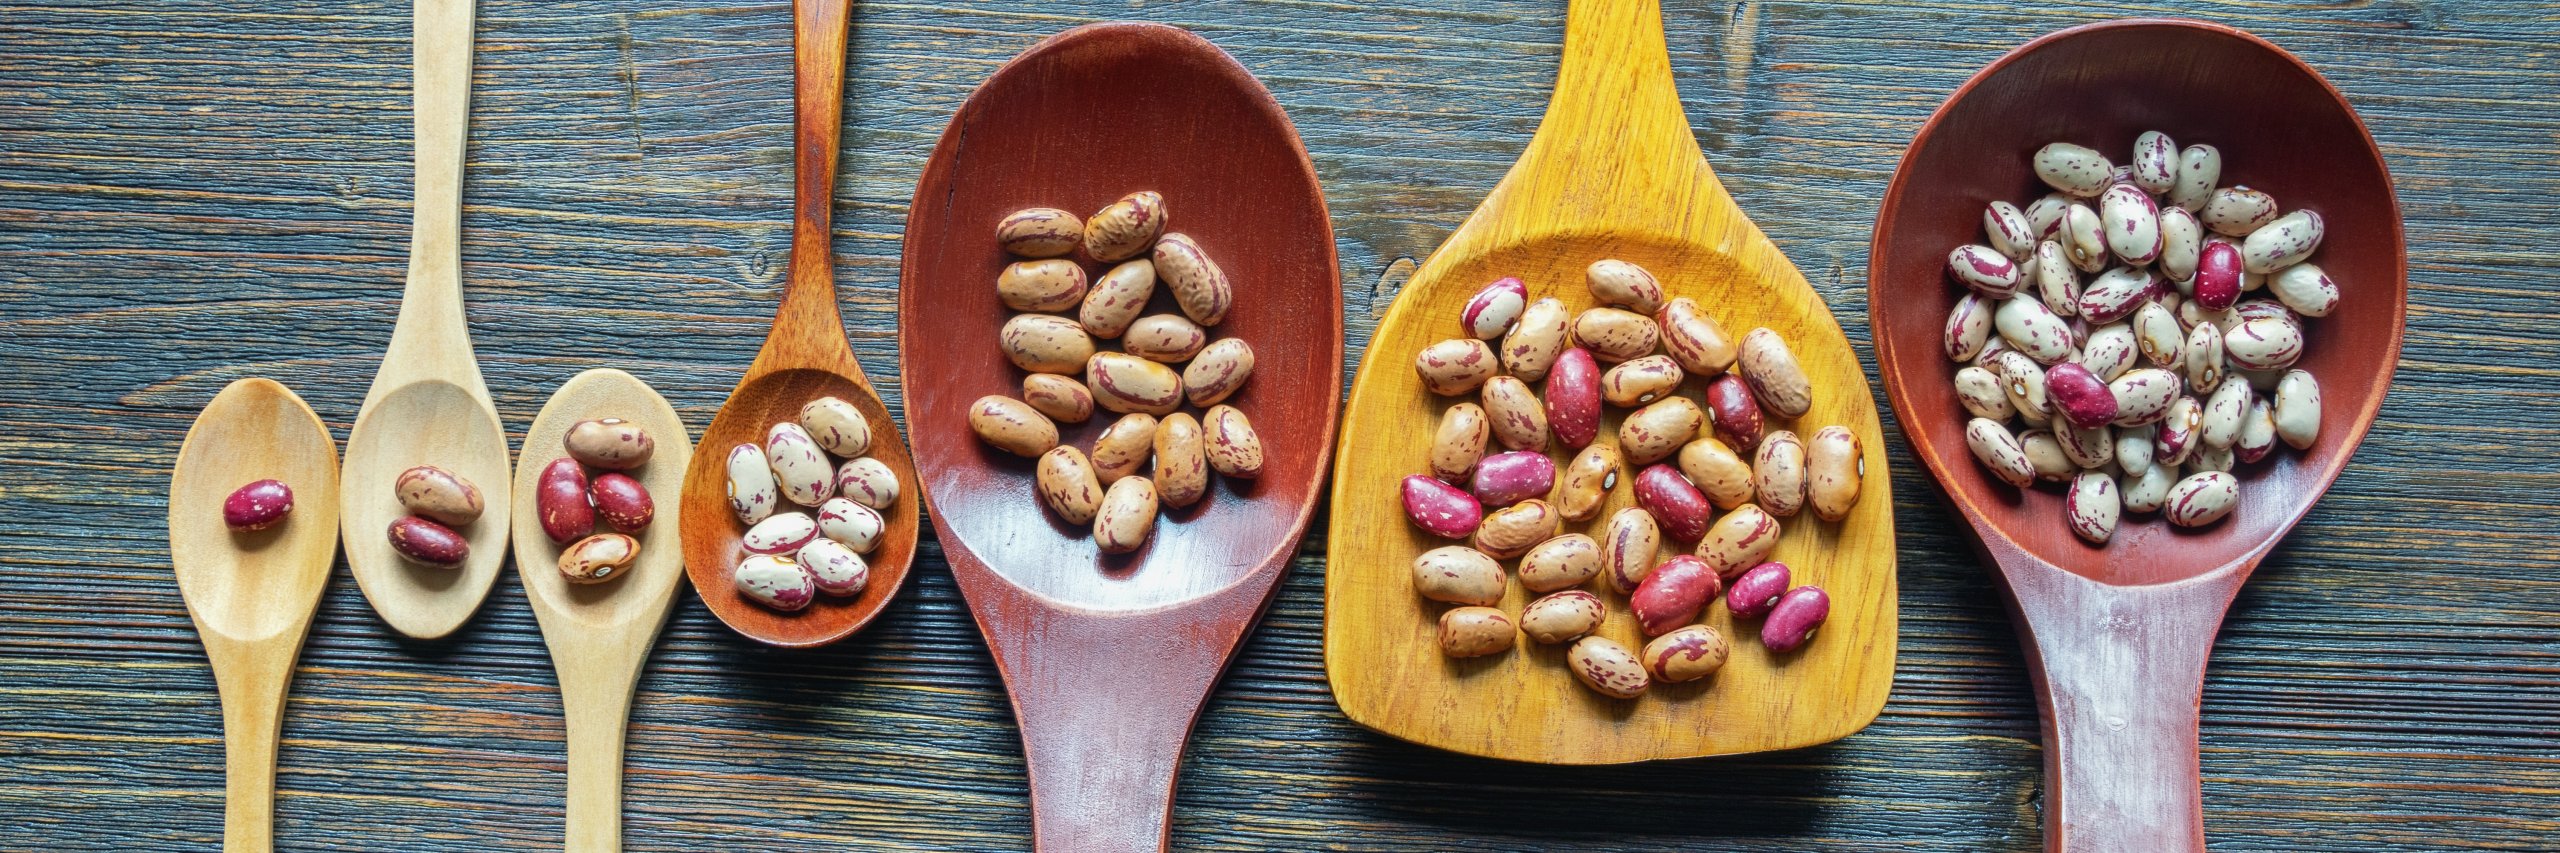
“Size/quantity fits my needs” is key when consumers are looking for something new.
When asked what factors are most important when shopping for a new product, the size and quantity outranked every other factor, including brand name, flavour and whether it is eco-friendly.
This suggests that when shoppers are looking for something new, there is an opportunity to attract new consumers away from other brands if you have a range of sizes fit for different purposes.
Brands need to consider their size and format range online with this in mind.
WHAT’S MISSING? 4 OUT OF TOP 7 ARE WITHIN BRANDS’ CONTROL
With 46% of shoppers using their mobile device to shop for groceries, it’s no surprise that product recognition is a challenge.
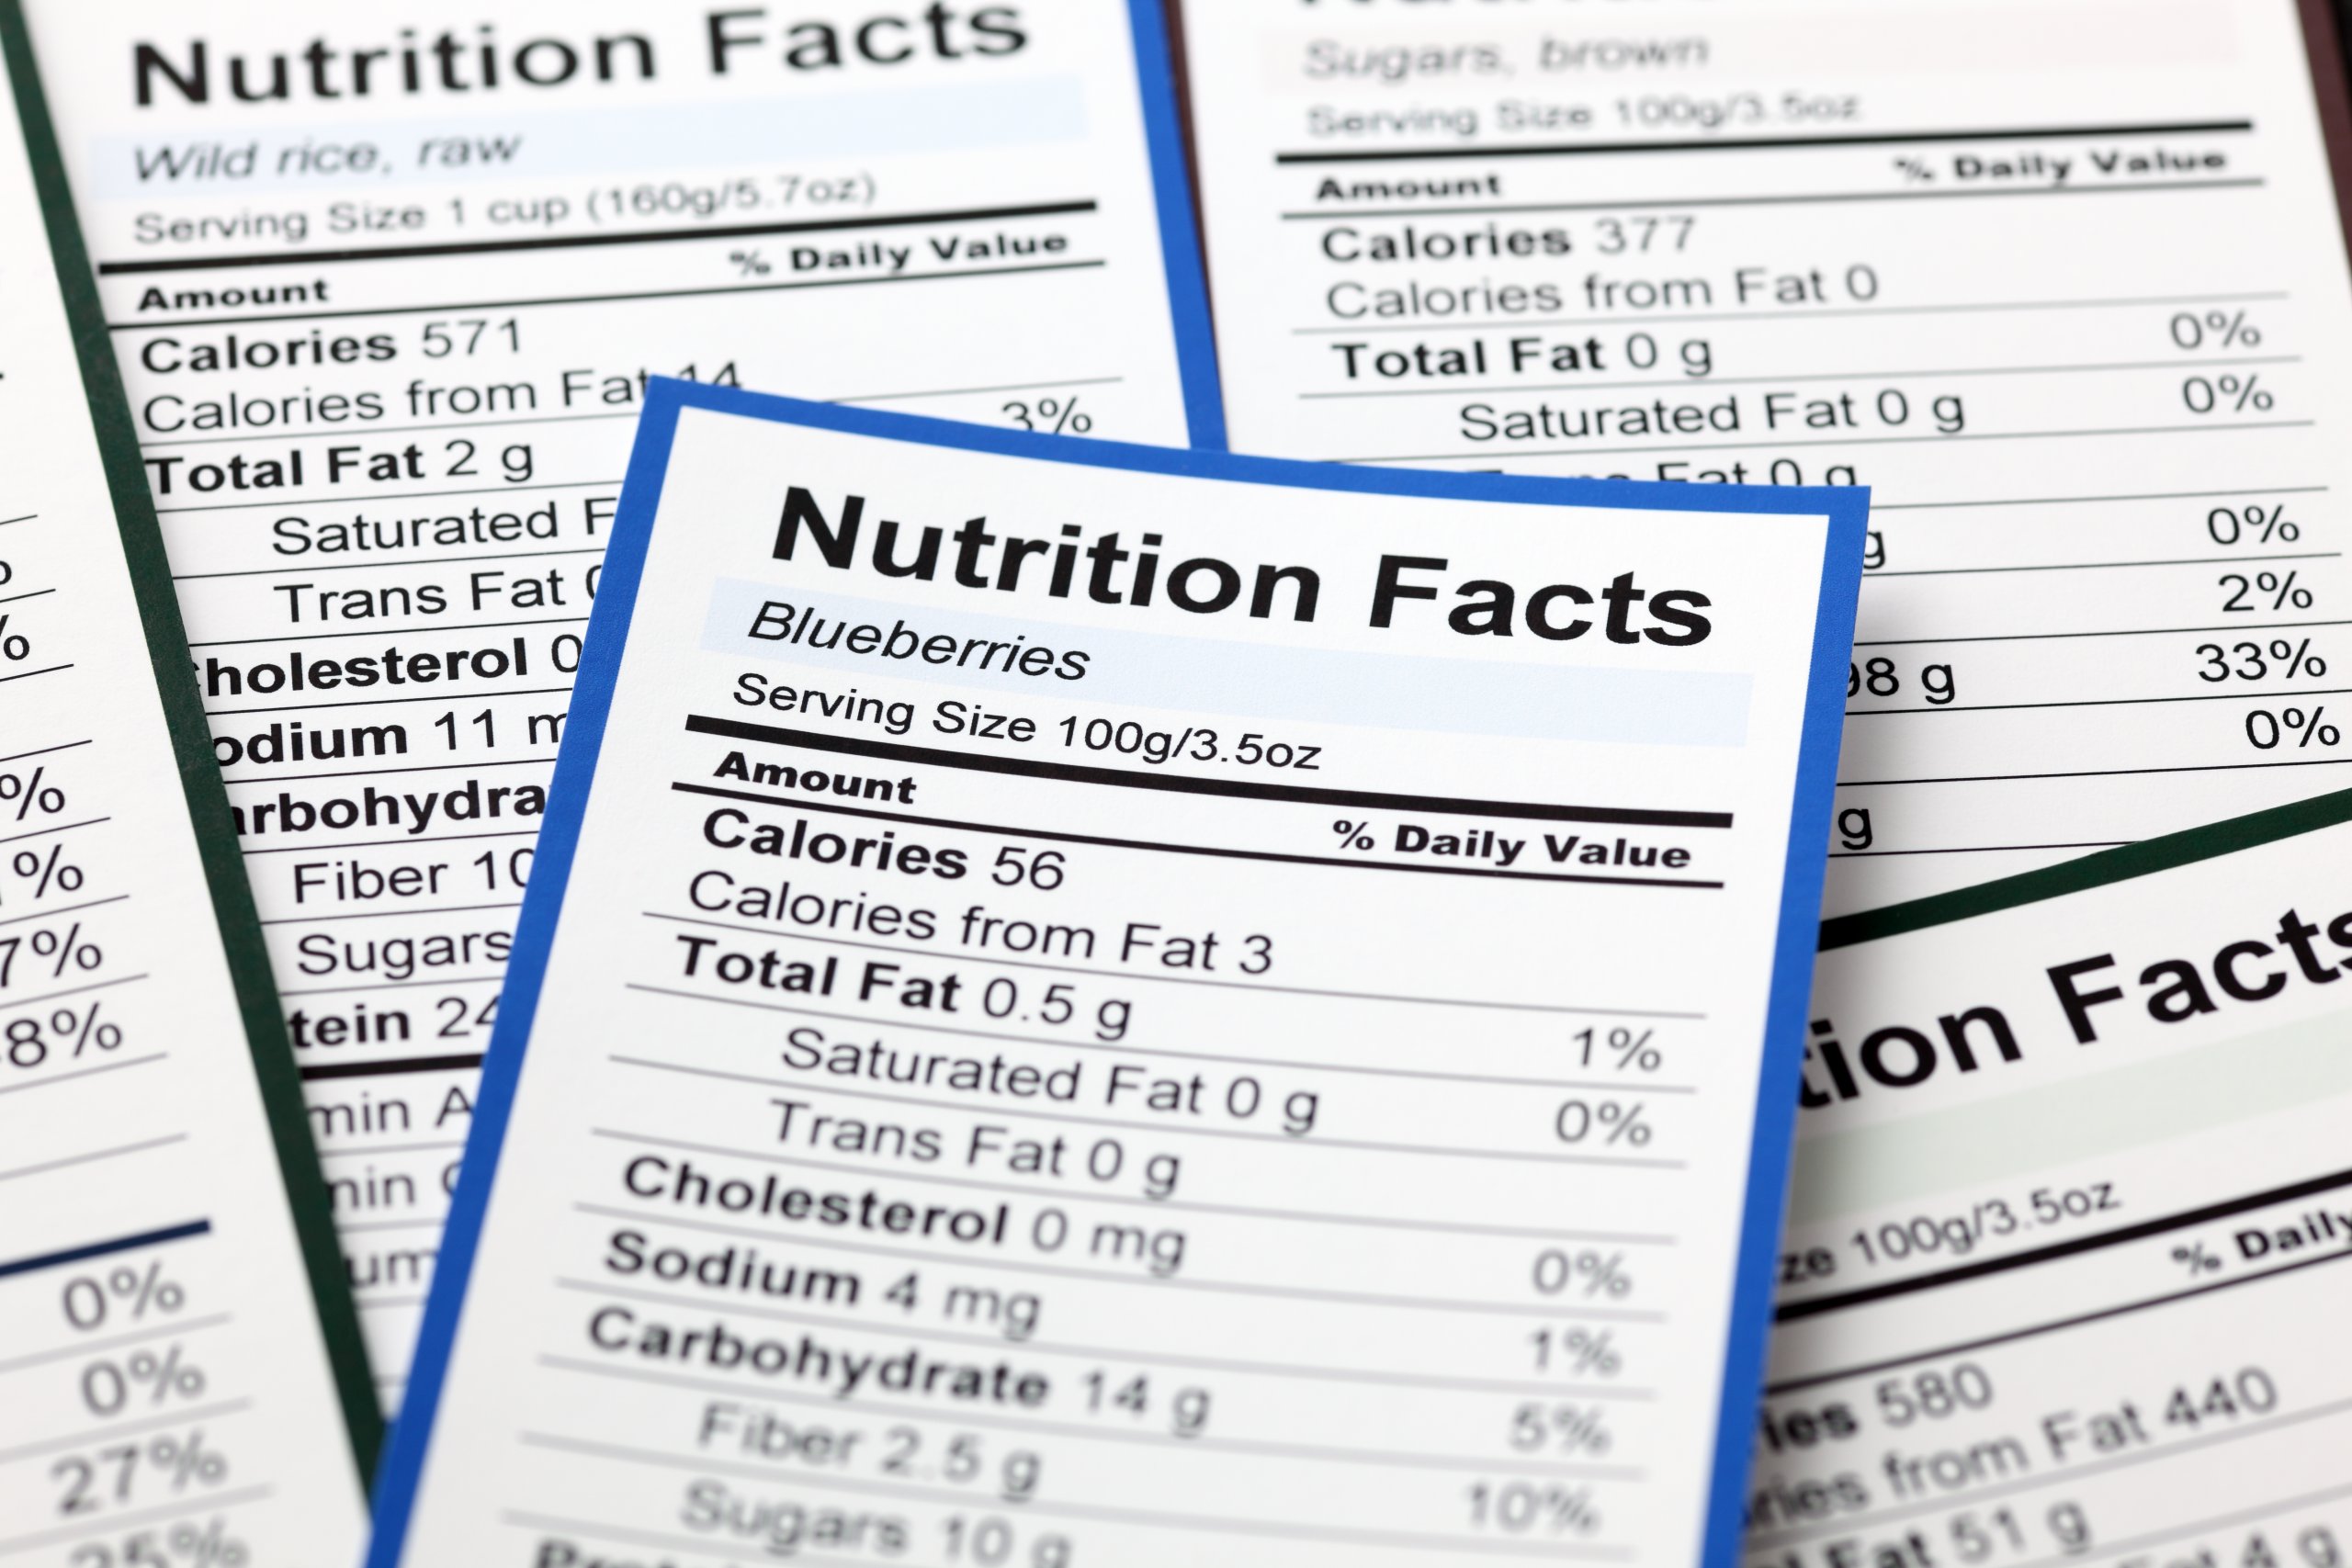
Product information and research are top concerns consumers feel are missing.
Ensuring you maximize product descriptions makes a big difference to consumers, who currently feel that access to this information is lacking.
- Ensure nutritional information image files are hi-res and mobile optimized.
- Additional information should include key claims.
- Consider having romance copy included to create a more engaging description, where permitted.
- Never assume claims or other details on pack can be easily viewed on the site.
- Ensure you have additional information about your products available on your own site, including recipes, sourcing and product benefits.

Consumer reviews and ratings matter to shoppers.
Consumer reviews (as opposed to industry reviews) rank high both in response to what shoppers want and what they do. Here are some key facts:
- Consumers spend a lot of time reading reviews – it ranks 3rd in what they spend the most time on while doing their shop. Even if they can’t read reviews on every site, they should be available on yours.
- Younger consumers spend the most time reading reviews
- “Recommendations from family and friends” would convince 21% of consumers to try something new, making referral coupons and incentives to become a brand ambassador tactics CPG brands should consider.
- You must respond quickly and professionally to both negative and positive reviews.
MEN LIKE SHOPPING FOR GROCERIES ONLINE DUE TO THE TIME IT SAVES THEM
With 46% of shoppers using their mobile device to shop for groceries, it’s no surprise that product recognition is a challenge.
WHAT CAN BRANDS DO TO MAKE IT INTO THE CART?
- Men prefer brand names. Visibility of the brand on pack is important to the male shopper.
- Men are concerned with time – delivery and ease of shopping are important to them. Focus on sites that ensure timely delivery and a positive user experience.
- If you are selling alcohol, frozen meals, prepared meals or meal kits, the male consumer is shopping your brand significantly more online than women. Take this into consideration when planning your marketing strategy.
- Men are most likely to add an impulse purchase to their cart if something is on sale – but they will also respond to pop-up coupons or even use coupons they’ve seen on social media.
WHAT ABOUT WOMEN?
Women have a strong preference for the store. 58% of women shop primarily in-store, while 26% shop primarily online compared to 41% of men who shop online for their big shop. Online, women are looking for either practical top-ups during the week, staples and specialty items.
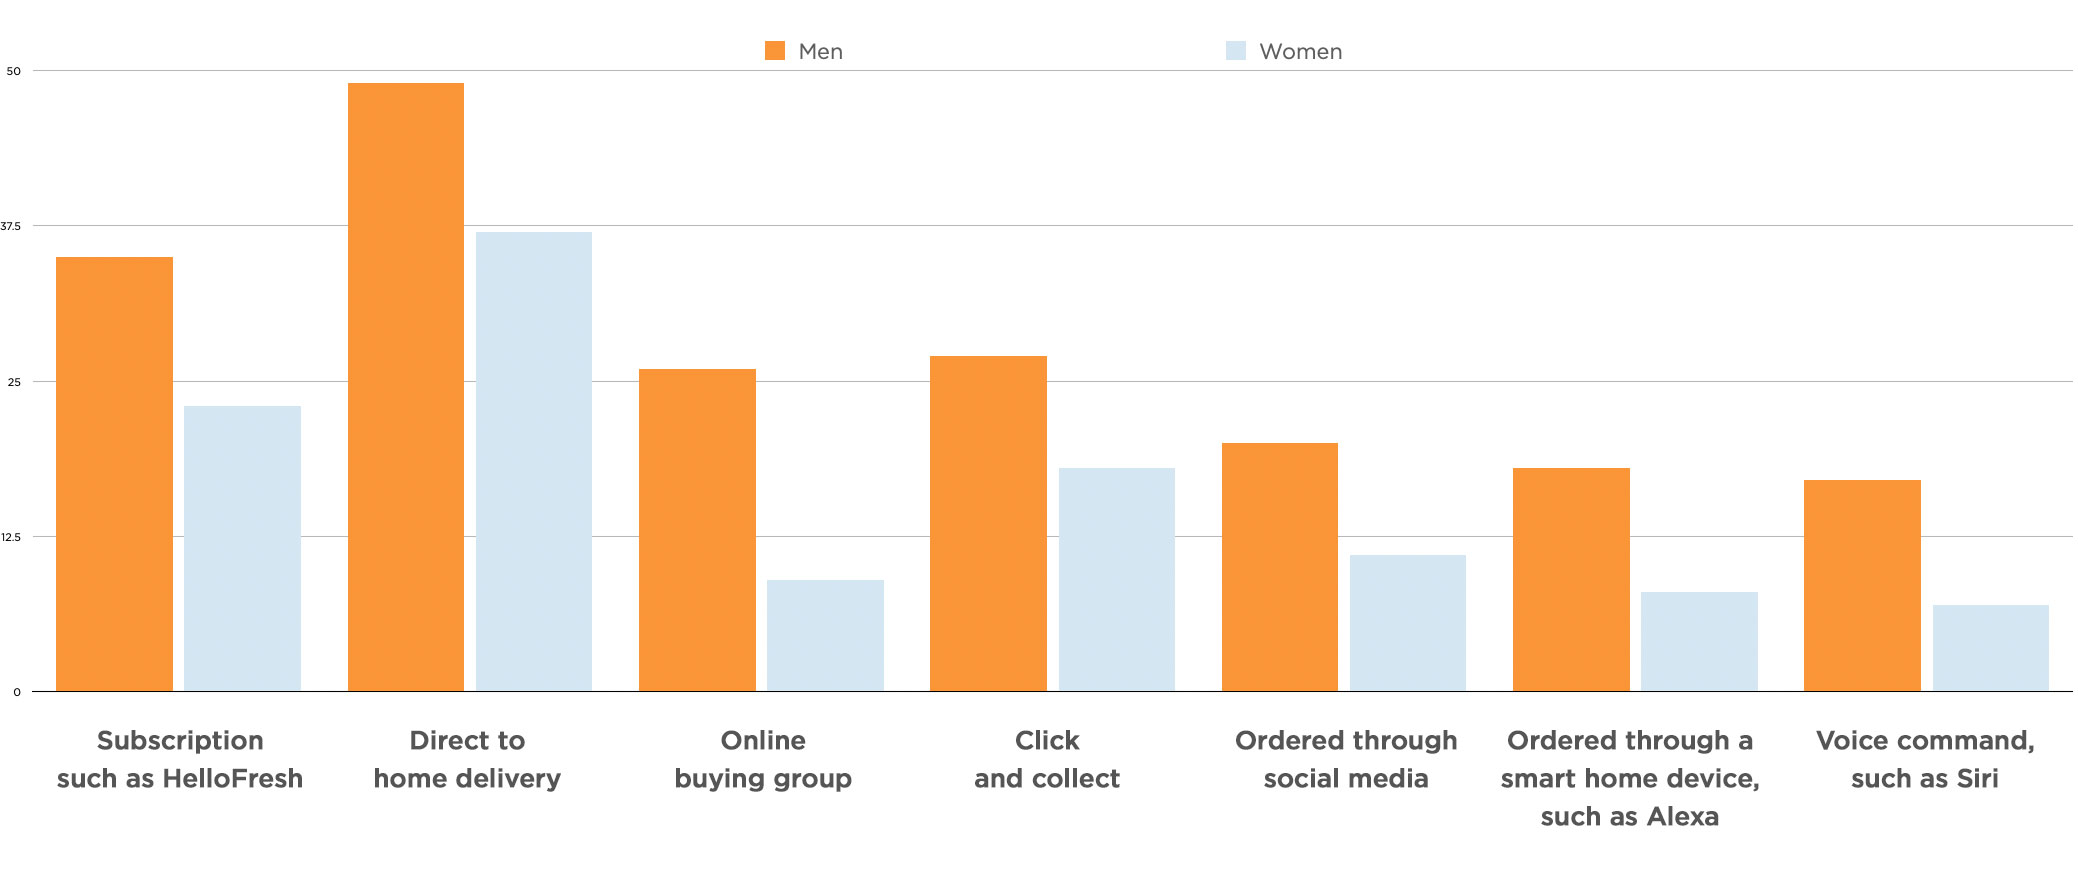
MEN USING ALL CHANNELS MORE THAN WOMEN
Q. Have you ever used any of the following services for grocery or to purchase items you might buy in a grocery store?
MEN - DEEPER DIVE

DADS WANT BRANDS
Dads are even more likely to stick with online shopping post-pandemic, at 67%. Brands are much more important to this group, who shop by brand name and are less likely to substitute a store brand than the overall sample. They do their big shop online and then head to the store during the week to stock up.

YOUNG & SINGLE
Young men who live on their own or with a roommate rather than a partner are shopping more on Amazon and specialty shops than the overall sample. During the shopping process they spend the longest time reading customer reviews, a big departure compared to older men.

TALK IT OUT
Middle aged married men who are in the higher income brackets are using voice command significantly more than other groups to order groceries – 28% have used a smart home device such as Alexa, with 25% using Siri through another device.
MILLENNIALS AND YOUNGER GEN X WITH CHILDREN ARE MORE LIKELY TO MAKE USE OF ONLINE GROCERY SHOPPING OPTIONS
58% of families with children shopped more online during the pandemic and plan to continue, compared to only 38% of respondents without children. The data suggests parents are driven largely by practicality.
WHAT CAN BRANDS DO TO MAKE IT INTO THE CART?
- Although parents are going online most often with a list, they also browse the site and are open to discovering other products. Sales and pop-up coupons are most likely to grab their attention.
- Parents of 1 – 2 children are very interested in exclusive products and will be looking for something new and interesting – offer LTOs and new products in baby and pet supplies, pharmaceuticals and personal care to these consumers.
- This group is also more motivated than the overall sample by social causes and sustainability. Designing call-outs on pack and product descriptions that will be visible at a quick glance on a mobile device is tricky, but with a simplified package and a reduced number of communication points, it can be done.
MORE ON PARENTS

FLEXIBLE MOMS
Unlike dads, moms are not as likely to use a list and stick with it. They browse by category (dads shop by brand), making it easier to catch their eye online. They are more willing to substitute their favorite brand for either another brand or a store brand if they can’t find their regular product online.
GROCERY STORE APP
Parents are most likely to do their grocery shopping on a grocery app, making mobile optimized imagery and clean, bold package design highly important for this group. Dads shop by brand while moms shop by category.
SEARCHING FOR SPECIALTY
Parents in the lower income group are more likely to state that their typical shopping behavior is to shop in store for their big shop and online for specialty items. This suggests that the stores they shop may have a more limited product range, pushing them to online for certain items.
THE HIGHER THE RESPONDENT’S INCOME, THE MORE LIKELY THEY ARE TO SHOP ONLINE
The high-income group exceeded any other demographic group in increased online grocery shopping due to COVID – and they plan to keep shopping online in the future.
WHAT CAN BRANDS DO TO MAKE IT INTO THE CART?
- A large number of this group prefers to shop online for staples and in-store for fresh. They are also the only group for whom bulk seems to have strong resonance. Multi-packs of premium everyday products will do well with these shoppers and also create an opportunity for a stronger visual in one large pack versus a smaller single unit.
- Attractive package design, product sourcing and information score higher as income increases.
- This group will add items if they get suggestions related to what’s already in their cart.
- They are strongly influenced by what they see on social media and may search out an item by name if they see it in their feed, making it crucial that premium brands have a strong social media presence and even offer coupons or samples.
- Their biggest pet peeve with online shopping is that they can’t discover new products as easily. Online shoppers want samples too!
- 41% of high income online shoppers choose Amazon, compared to 39% of the total sample – they do shop the grocery site as well but over index with Amazon.
INCOME DIFFERENCES
Income is one of the biggest factors that determines whether a consumer will shop online or in the store. Here are the most significant factors:

BIG GAP
16% of lower income consumers prefer online shopping compared to 41% of higher income consumers. 48% of lower income shoppers prefer the store, compared to only 22% of high income consumers.

VALUE
It’s important to note that value was a top priority for every income group – even the highest earners will look for coupons and be swayed by a sale.

AMAZON
41% of high income earners shop Amazon, representing the most active group utilizing this site.

PRIORITIES
The factors high income earners think would most improve the online shopping experience:
#1 Accurate delivery
#2 Easy product recognition
#3 Price comparison

RATINGS
When asked about how much time they spend on each step in the process, higher income earners spend the most time reading product reviews.

COVID
55% of high income earners say they shopped more online during the pandemic and plan to continue.
YOUNGER CONSUMERS
When we isolate the data by age, we can see some trending behaviors that are important for CPG brands to know. Here are some emerging behaviors of younger consumers that may develop into more significant trends over time.

3D VIEW OR VIDEO
Parents are most likely to do their grocery shopping on a grocery app, making mobile optimized imagery and clean, bold package design highly important for this group. Dads shop by brand while moms shop by category.
PEER REVIEWS
Young consumers want to get tips from friends and family to find out about products, whereas these methods of learning about new products was low for other age groups. They are also avid readers of reviews. Brands should ensure a validated consumer review program and engage with younger consumers in a 2-way conversation to build trust.

SEARCHING FOR SPECIALTY
Parents in the lower income group are more likely to state that their typical shopping behavior is to shop in store for their big shop and online for specialty items. This suggests that the stores they shop may have a more limited product range, pushing them to online for certain items.
CPG GOES DTC
GROWING YOUR DTC STRATEGY
When compared to grocery sites and Amazon, consumers are not currently shopping CPG DTC sites very much. While this may be disappointing, the study showed there are opportunities to increase these numbers and gain greater DTC share and engagement.
HIGH-LEVEL VIEW
- When we asked consumers what factors would entice them to shop on another site, cost savings factors topped the list: free delivery, coupons and better prices. However, there was a second tier of responses that we think offer a key opportunity for brands: the specialty item shopper and the special event shopper.
- We also noticed an interesting trend. The younger consumer segments reported higher levels of shopping at specialty or branded sites – in fact, the youngest consumers shopped such sites more than twice as much as all other age groups. They also shop aggregate sites at higher rates. While the overall numbers are still low, if this trend continues, Gen Z is a key opportunity for brands’ own DTC sites.
THE SPECIALTY ITEM SHOPPER

Brands can attract consumers to shop DTC through specialty items. Canadians are over-represented in this group, potentially due to more sparse population density, making it harder to find these items in a physical store.
An urban professional with no kids, foodie Lou prefers to shop in store to select items carefully by hand. He is willing to spend a little more money and effort to get something special – in fact, he enjoys taking the time to discover new products and experiences. Although he prefers in-store shopping, when he wants something special he will search online. For example, he has a subscription to a coffee brand that delivers a range of beans based on his personal preferences, along with filters, cream and turbinado sugar, every week to his door. He takes some pleasure in trying new things, like that time he used Groupon to get a case of wine. Sometimes it works out and sometimes it’s just fun to try something new. But when he hits on something great, he delights in sharing it with his friends and might just gift them a sample for the holidays.
- SUBSCRIPTION: Offer subscriptions focused around hero items that include new product discovery – think everyday luxuries.
- LOCAL: Use a big brand platform to support local brands and offer a “mixed bag” of big name and small niche products.
- SOCIAL: Build a strong presence on social media as a foodie brand and enable purchasing through social media.
- UNIQUE: Offer unique items that are only available on your DTC site, including products created through partnerships.
- CANADIAN: For Canadian brands, the opportunity here is big: 38% of consumers are looking for specialty items online.
- MEN: Men are more likely to try new shopping methods, so keep that in mind as you plan your strategy.
THE SPECIAL EVENT SHOPPER

27% of shoppers who prefer the in-store experience go online when they are looking for a specialty item and 13% go online to shop for a special event. Canadians, women and shoppers over 54 dominate this group. Here are some key opportunities for brands to explore with this consumer.
Sharina is a professional mother of two teenaged kids who juggles a million things. She prefers to do her big shops in the store so she can select fresh items by hand and chance upon new products, but when it comes to birthdays, holidays and BBQs, she often goes online to find an easy solution to make the event special. She may be looking for a special dessert, premium snacks that look gourmet, goodie bags, decorations and gifts – and if she could find them all in one place with free delivery, her life would be much easier. She’s strongly influenced by recommendations from her peers and also enjoys sharing her own positive experiences. She is even somewhat intrigued by the idea of becoming a brand ambassador and is likely to post a glowing review on her own social if she likes a product or has a great experience.
- PACKAGES: Create special event packages for a range of holidays and events that offer an all-in-one, customizable solution.
- GIFTS: Offer gift-able items such as a beautifully packaged favorite products, gift bags and collectibles such as tins.
- INCENTIVIZE: Give consumers coupons in return for online reviews and shares. Thank consumers for their reviews to encourage engagement.
- TEST: Explore new product ideas through LTOs that are party-worthy. This gives brands an opportunity to test new products.
- CAUSES: Integrate party packages with donations to social causes or partner with donation programs such as Echoage.
- COMMUNITY: Pop ups at local foodie related events, such as farmer’s markets, will offer an opportunity to meet this consumer.
THE GEN Z SHOPPER

Although few consumers overall say they bought directly from a CPG brand website, with 16 – 17 year olds the number is more than double all other age groups combined. They were also more than twice as likely to have shopped at a specialty store. This is a signal that the younger consumer should be a key group to target.
In grade 11, Cole finds day-to-day life somewhat stressful, but his enclave of friends (both IRL and online) are his safe haven away. He uses his parents’ Amazon account to shop for groceries and to order delivery services like Skip the Dishes, and is very comfortable using any kind of e-commerce platform. He has pretty adventurous tastebuds and will seek out limited time offers that seem exciting or strange, especially if he hears about it through one of his favorite YouTubers or Twitch streamers. For Cole, prestige isn’t about luxury items or big brand names: it’s about being the first to discover something unique that speaks to his personal interests.
- PARTNERS: LTOs, especially those through highly relevant partnerships (video gamers, in-game concerts, TikTok influencers), will drive excitement.
- CUSTOM: Personalization of products, from flavor to package design, to personalized swag will help with appeal.
- FAST & FREE: Free same-day delivery – Gen Z spends much more time than any other demographic tracking their purchase.
- ENGAGE: Create a strategy and ensure adequate resources to give Gen Z the 2-way engagement they expect.
- VALUE: Fun, playful offerings with student discount. Ensure a strong loyalty program with fun rewards.
- VALUES: Ensure you speak Gen Z’s language around values – there is a huge gap between Boomers and Gen Z.
THE GREAT NEWS
There are a number of exciting opportunities for CPG brands to create more well-rounded offerings through online channels. Even on partner sites, such as through grocery stores or Amazon, brands have more power than they are currently leveraging to make the shopping better for consumers. And when it comes to DTC strategies, innovation and imagination are the key tools brands can use to maximize greater ROI and brand loyalty.